The short version
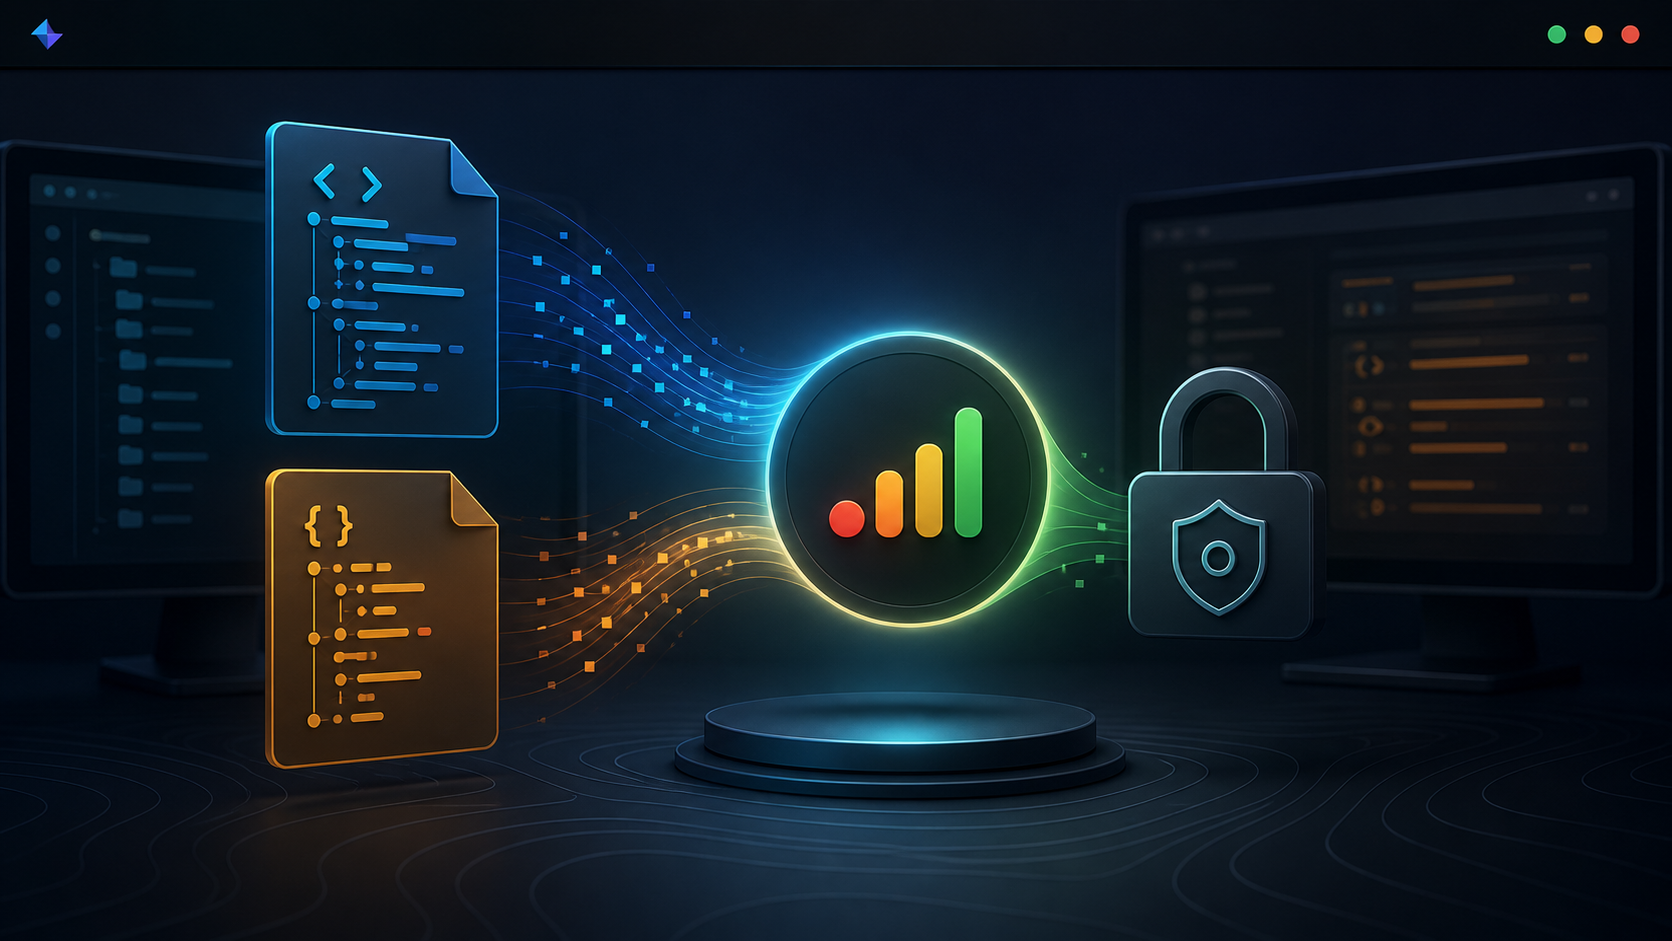
- Local Test Pulse reads one configured report file and shows PASS, FAIL, FLAKY, STALE, ERROR, EMPTY, or SETUP in the Omarchy bar.
- It supports JUnit XML, pytest-json-report JSON, and Playwright JSON reporter output.
- It never runs tests, accepts arbitrary commands, writes to the report, sends telemetry, or needs a token.
- Old, malformed, contradictory, oversized, changing, or unsafe input cannot become a green result.
- One shared parser and state service feeds the widget on every monitor, so the desktop does not start duplicate parser runs.
A test suite can finish correctly and still fail operationally. The report lands in a file, the terminal scrolls away, and the developer starts another task. Adding another hosted dashboard fixes visibility by creating a second system to open, authenticate, maintain, and trust.
I wanted a smaller answer for my Omarchy desktop: let the test runner produce its normal report, then surface only the state that matters in the bar where I already work. That became Local Test Pulse.
A warning light for one existing report
Think of a car dashboard. The oil light does not manufacture oil or repair the engine. It reads a signal and tells you whether attention is required. Local Test Pulse works the same way. Your CI job or local test command writes a report. The plugin reads one absolute path, validates the format, checks freshness, and publishes a small status model to Quickshell, Omarchy's desktop shell layer.
pytest / Playwright / JUnit producer
                |
                v
       existing local report
                |
                v
 bounded Python adapter
                |
                v
 singleton Quickshell service
           |              |
      monitor 1      monitor 2
There is no recursive project discovery and no report history database. Version 0.1.0 deliberately answers one question: what does this configured report say right now, and is the file safe enough to display?
Green needs more proof than a passing counter
Test report formats are more complicated than a top-level passed: true. Setup can fail before a pytest call stage. Teardown can fail after the assertion passed. Playwright can recover on retry. JUnit suites can declare totals that contradict their nested cases. A naive parser turns these edge cases into false confidence.
Freshness is conservative. When a supported producer timestamp exists, the plugin compares it with the file metadata and uses the older signal, so touching yesterday's report cannot make it look new. Without a producer timestamp, freshness relies on filesystem modification time. A timestamp materially in the future also fails visibly instead of passing.
Why reading one local file still needs security engineering
Local does not automatically mean safe. A configured path can point to a symbolic link, FIFO, socket, directory, device, oversized file, invalid UTF-8, or a regular file being replaced during the read. A parser can also be exhausted by extreme nesting, width, duplicate keys, non-finite values, entity declarations, or unbounded failure text.
- The adapter accepts only absolute paths to regular files and rejects symbolic links and special files without blocking.
- The secure open uses
O_NOFOLLOW | O_NONBLOCKwhere Linux provides them, then usesfstatto verify the already-open object is a regular file. - Input is capped at 4 MiB before strict UTF-8 decoding. Exactly 4 MiB is permitted; one byte more is rejected.
- File identity, size, modification time, change time, and exact bytes read are checked so a changing file cannot publish a mixed snapshot.
- XML document type and entity declarations are rejected. JSON duplicate keys, non-finite numbers, excessive depth, and excessive width are rejected.
- The adapter emits at most 1 MiB of ASCII-safe JSON. QML, the interface language used by Quickshell, applies its own timeout and output ceiling.
- Report-derived strings render as plain text, not rich QML markup.
Each report format keeps its own rules
JUnit XML, pytest-json-report, and Playwright JSON describe test execution differently. The adapter does not flatten them into one simplistic counter. It validates each producer's lifecycle rules first, then returns only what the UI needs: totals, failures, recovered flaky tests, duration, timestamps, and a limited number of detail rows.
- JUnit reconciliation checks declared counters at every suite boundary, not only the root.
- Pytest lifecycle handling derives outcomes from setup, call, and teardown evidence instead of trusting a top-level pass claim.
- Playwright counts logical tests rather than retry attempts and requires coherent retry history before labeling a test flaky.
- Aggregate totals are computed before display caps, so truncating detail rows cannot hide the real count.
Install, configure, and smoke-test it
Local Test Pulse 0.1.0 requires Omarchy 4 with Quattro on Linux and Python 3.11 or newer.
omarchy plugin add https://github.com/godhiraj-code/omarchy-local-test-pulse --enable --yesIn Omarchy's plugin settings, configure reportPath, choose auto, junit, pytest, or playwright, then set the refresh and stale thresholds. Auto detection is conservative. If the file is ambiguous, choose the format explicitly rather than asking the plugin to guess.
The plugin uses one shared parser and state service across monitors and prevents overlapping refreshes. A settings change immediately invalidates the old state. If a parser started under the previous path, format, or threshold, that older run is not allowed to publish after configuration changes.
Before relying on the bar, run the adapter against a known report from the repository checkout, then check the UI with known inputs. The widget should show SETUP before configuration and should move to PASS, FAIL, or STALE when you point it at corresponding reports.
python3 scripts/report_status.py --report /absolute/path/report.xml --format auto --stale-seconds 86400How I checked the release
Version 0.1.0 was validated with the official Omarchy plugin validator and exercised from its exact Git archive under Quickshell 0.3.0 on a physical two-monitor Omarchy 4/Quattro desktop. The repository contains 41 Python tests plus Node model checks, shell and JSON validation, and Python compilation checks.
The live run covered pass, fail, flaky, stale, error, and unconfigured states; hostile plain-text rendering; periodic refresh; and configuration invalidation. The full test and threat-model details remain in the repository rather than being duplicated here.
Who benefits from this small signal
- Useful when local development or a nearby automation job already writes one of the supported report formats.
- Useful when a developer wants an ambient signal without uploading test evidence to another service.
- Useful on a two-monitor workstation where the same result should remain consistent everywhere.
- Not a CI server, test runner, flaky-test history system, trend dashboard, remediation engine, or project discovery tool.
- Not a substitute for opening the full report when the bar says FAIL, FLAKY, STALE, or ERROR.
The source, threat model, installation command, and complete test suite are available in the Local Test Pulse repository.